Editing a TestCase Chart from Azure DevOps
As you all know these TestCase execution charts are used to view the progress or the TestCase Execution data for Test Suites & TestPlans. We have already seen about how to create and view TestCase Execution chart. Here let us see about how to edit a TestCase chart and change colors or someother options
Step 1: Go to Azure TestPlans, Select the TestPlan in which you have to edit one of the charts
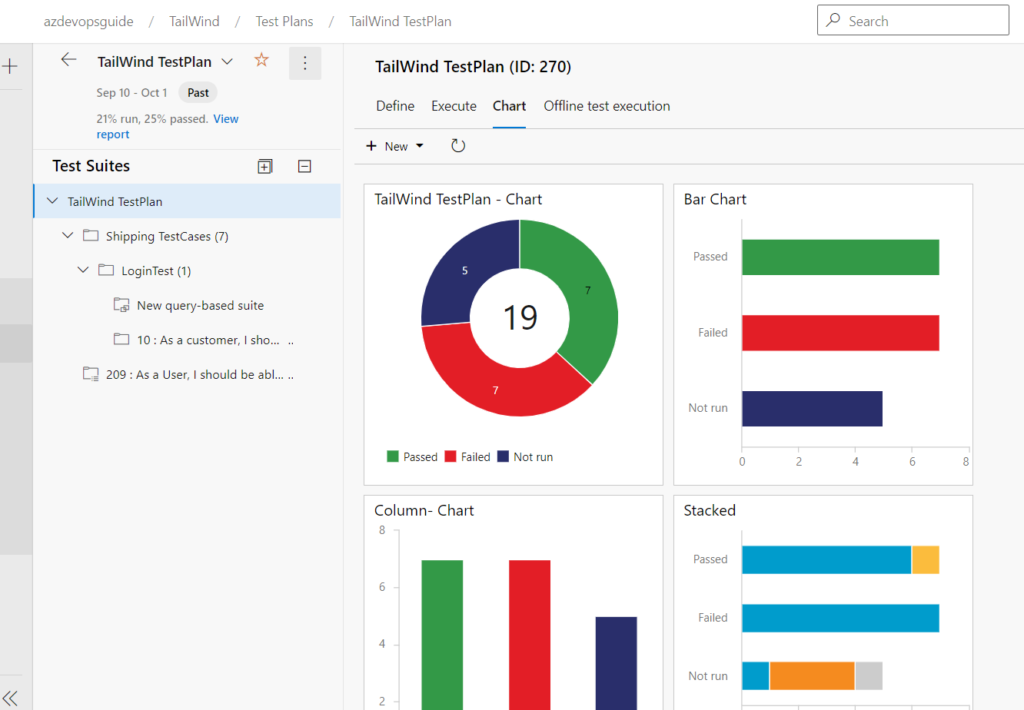
Step 2: Charts will be displayed as shown below

Step 3: To edit the first chart, click on the 3 dots next to the chart heading
Step 4: Click on the “Edit” option from the menu

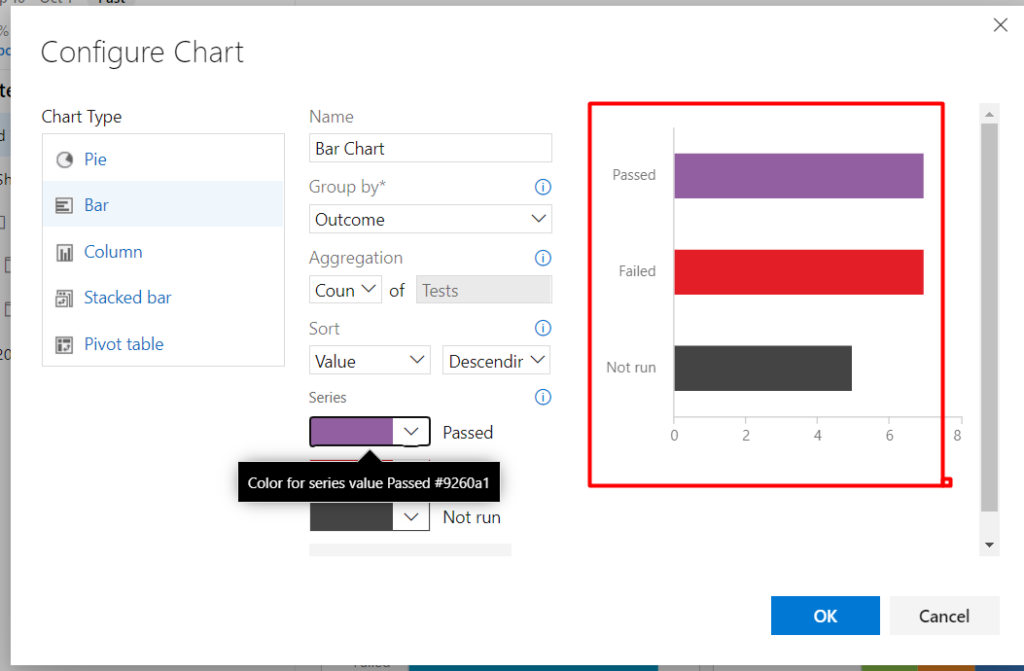
Step 5: In the configure chart option, you can choose different colors as shown and then click on “Ok” button

Step 6: As you see below the updated chart will be displayed as shown

